November 1, 2016 – KERR MARKET SUMMARY – Volume 6, Number 21
Central banks around the globe worked in unison during the financial crisis to save the world from financial calamity, and have so far remained accommodative to help further the economic recovery. In addition to providing relief to consumers and business alike, equity investors have enjoyed a largely unencumbered bull market for over eight years now. Until recently the valuation expansions have been supported by rising corporate profits. Lately though, a profit recession over the last year and a half has had many wondering if the existing rich valuations are sustainable, especially in light of a more hawkish Fed. What’s more, central bankers in Europe and Japan are seeing the limitations of easy money policies as evidenced by the IMF’s continued downgrades to global growth – suggesting that loose money policies may be less effective going forward. Halloween or not, there will always be something that can put a scare into investor sentiment. This past month markets moved trepidly in the shadow cast by the rancour of the U.S. election and the nigh of a December Fed rate hike.
 Equity markets started off the month in a funk on investor worry of what the third-quarter earnings season would bring. Other economic concerns also weighed on their minds and the declines may have reflected some profit taking on recent gains. The British pound took additional lumps over fears of a “hard Brexit”, the Sterling falling to a 31-year low against the U.S. dollar on sternly toned news of a March 2017 target date to start the Brexit process. U.S. economic data was generally favourable – showing improvements in the manufacturing index, record-high vehicle sales, and an increase to labour force participation. Nevertheless, the good news also signifies the beginning of the end of historically low interest rates with a more than likely December Fed rate hike. Stocks weakened on the first trickle of corporate earnings data. There was negative reaction to earnings kick-off with Alcoa falling short of expectations, but the mood improved with the Financials sector reporting that JPMorgan Chase, Citigroup, and Wells Fargo had better-than-expected results. For the first half of the month, Canadian and U.S. equities were down 1% and 1.6% respectively. European markets were also down 1.3% and Japanese equities were up 1.5% on increased inflows due to its safe haven status.
During the second half of the month, markets continued with their cautious state. In the midst of the third-quarter earnings results the tech-focused Nasdaq Composite Index initially surged in large part due to positive earnings reports by Netflix and Microsoft. Microsoft also finally returned to its record high – first established in 1999. The NASDAQ’s performance was eventually stalled by heavily-weighted Apple and Amazon on a poorly received profit and earnings outlook. Macroeconomic news was scant, though rising oil prices and reassuring Chinese economic data helped the Energy and Materials sectors. The resurfacing of the Clinton e-mail scandal possibly influenced markets as the Clinton lead in the polls started to weaken. European markets gave up another 2% and Japanese equities slipped 0.2%.
At the end of October, most major markets presented modestly negative returns, except for Japan at 1.3% and Canada at 0.6% – benefiting from a 2% gain in energy that offset the losses from two-thirds of the TSX index. The S&P 500 was down 1.8% for the month while European indices declined 3.2%. The Canadian dollar depreciated 2% on expectations of Fed tightening – improving matters somewhat for internationally diversified portfolios. Despite a number of issues including the vexing U.S. political scene and ongoing Fed indecisiveness, global markets have proven resilient. The question marks raised by the Brexit have yet to affect Europe, Chinese growth has stabilized and U.S. economic growth has been improving. Nevertheless given the tenure of this bull market, investors have been restrained in their risk taking. Looking ahead, despite what fright may lurk in the corners of the financial world, we remain partial to equities and the markets’ ability transition from dependence on monetary stimulus to responding affirmatively to an eventual resurgence in corporate earnings.
NEWS FOR THE SECOND HALF OF OCTOBER
The Thomson Reuters/University of Michigan consumer sentiment index declined to 87.2 in October from 91.2 in September, as consumers were less optimistic about prospects for the economy, amidst uncertainty about the election.
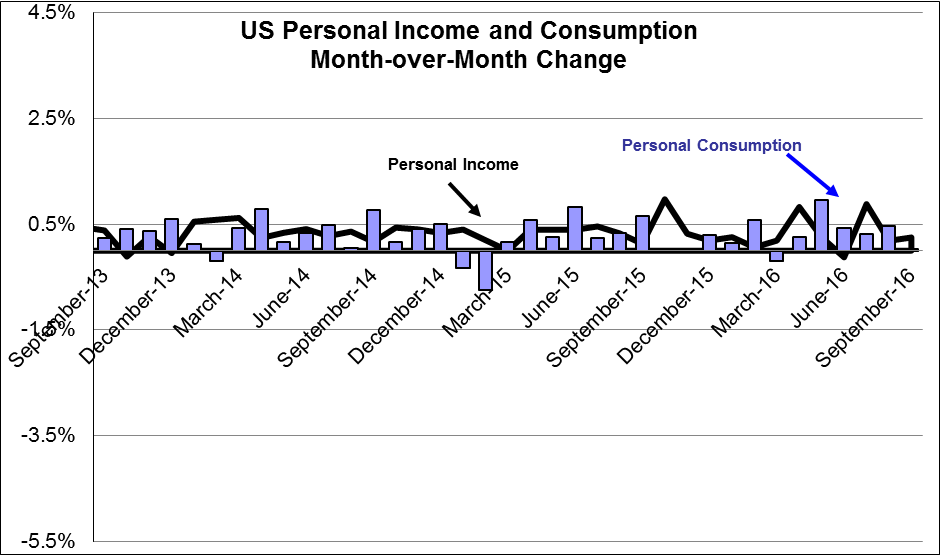
Personal income rose by 0.3% in September, below expectations. Personal spending was up by 0.5%, beating expectations.
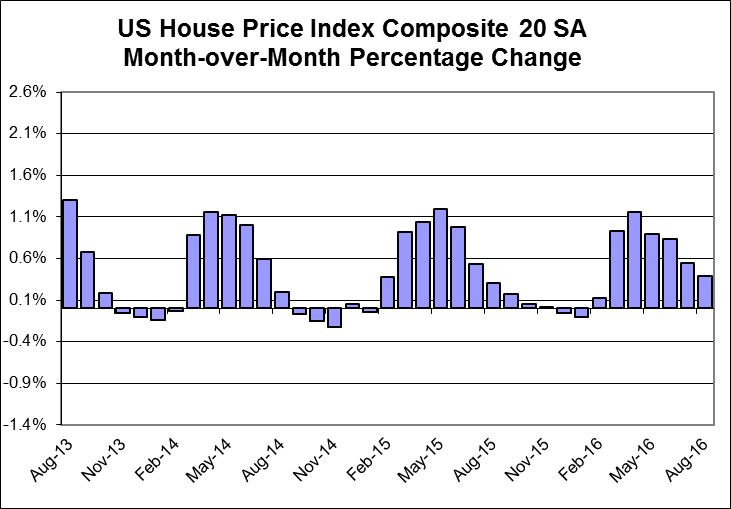
Home prices rose modestly in August with the S&P/Case-Shiller home price index up by 0.2% for the month and the year-over-year increase at 5.1%, up from 5.0% in July.
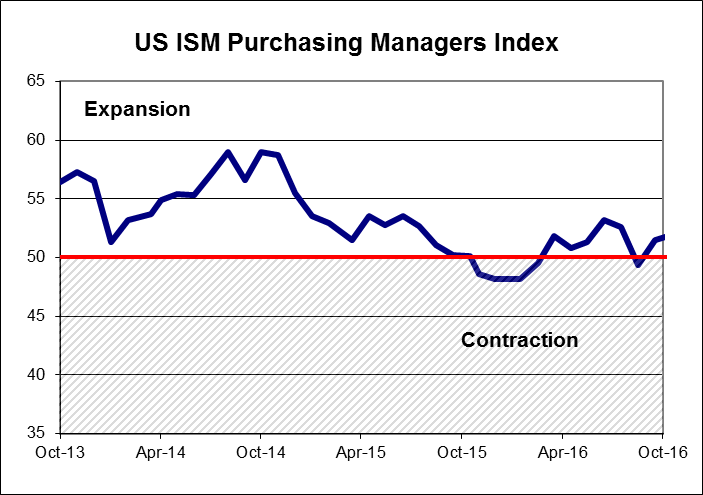
The ISM Manufacturing index rose in October from 51.5 to 51.9. Increased production and employment led to the increase, but new orders fell.
OTHER ECONOMIC NEWS
US housing starts for September declined to 1.047 million units, annualized, falling below forecasts for a modest increase. The decline was concentrated in the volatile multi-family segment sector. Building permits rose by 6.3%, surpassing expectations, with most of the improvement in multi-family dwellings. Existing home sales in the US rose by 3.2% in September to 5.47 million units, with all of the improvement concentrated in the single-family sector. September sales of new homes in the US rose by 3.1% to 593,000, on an annualized basis. August’s sales pace was revised downward to 575,000 from the previously reported 609,000. Orders for durable goods in the US for September dipped by 0.1%. Orders for non-defence capital goods, excluding aircraft, a close proxy for business investment, fell by 1.2%, following three consecutive monthly increases. US consumer prices rose by 0.3% in September, led by energy costs, causing the annual inflation rate to rise from 1.1% to 1.5%. The first estimate of US third quarter GDP came in at 2.9%, annualized, following three tepid quarters averaging 1.0% growth.
CANADIAN ECONOMIC NEWS
The Canadian economy experienced continued growth for the third straight month in August as GDP rose by 0.2%, following strong increases the previous two months. Canadian retail sales declined by 0.1% in August, the fourth consecutive monthly decline. Canadian manufacturing sales increased by 0.9% in August. The Canadian inflation rate rose to 1.3% in September from 1.1% in August. Rising gasoline prices accounted for much of the increase.
Sources: TD Securities, Case Shiller, Reuters, Institute for Supply Management, Thomson Reuters/University of Michigan, Commerce Department, National Association of Realtors, Statistics Canada.
October 31, 2016Total Returns in CDN$ |
1M |
3M |
1Y |
3Y |
5Y |
10Y |
Canada |
|
|
|
|
|
|
S&P/TSX Composite |
0.62% |
2.12% |
12.71% |
6.57% |
7.01% |
4.84% |
S&P/TSX 60 |
1.39% |
3.22% |
12.75% |
7.38% |
7.69% |
5.05% |
Cdn. Energy |
2.10% |
8.81% |
16.97% |
-6.17% |
-2.78% |
-1.59% |
Cdn. Materials |
-0.91% |
-8.39% |
44.29% |
3.43% |
-7.06% |
1.52% |
Cdn. Industrials |
0.01% |
2.59% |
14.47% |
9.40% |
14.97% |
9.13% |
Cdn. Consumer Discretionary |
-2.25% |
0.87% |
-2.13% |
11.64% |
18.38% |
7.19% |
Cdn. Consumer Staples |
1.31% |
1.69% |
14.15% |
22.29% |
23.17% |
13.10% |
Cdn. Health Care |
-8.22% |
-12.57% |
-27.02% |
-1.28% |
10.52% |
7.98% |
Cdn. Financials |
2.60% |
5.81% |
11.81% |
8.98% |
12.81% |
6.77% |
Cdn. Information Technology |
-1.68% |
1.11% |
11.54% |
20.94% |
16.06% |
6.92% |
Cdn. Telecom. Services |
-0.68% |
-2.38% |
14.44% |
14.20% |
14.12% |
9.66% |
Cdn. Utilities |
1.52% |
-0.74% |
20.37% |
9.47% |
6.13% |
6.66% |
U.S. & International ($CDN) |
1M |
3M |
1Y |
3Y |
5Y |
10Y |
|||||
S&P 500 (LargeCap) |
0.32% |
1.06% |
7.07% |
18.33% |
20.57% |
8.61% |
|||||
Russell 2000 |
-2.67% |
0.73% |
6.67% |
13.21% |
18.39% |
7.85% |
|||||
World |
0.23% |
1.53% |
4.29% |
13.51% |
16.41% |
6.35% |
|||||
Europe |
-1.13% |
0.63% |
-4.61% |
6.04% |
11.43% |
3.15% |
|||||
Japan |
3.53% |
6.35% |
6.09% |
13.19% |
14.63% |
3.01% |
|||||
Pacific ex-Japan |
0.04% |
1.81% |
12.55% |
6.99% |
10.20% |
7.11% |
|||||
EAFE (Europe, Aus, Far East) |
0.10% |
2.05% |
-0.35% |
7.79% |
11.98% |
3.51% |
|||||
EM (Emerging Markets) |
2.44% |
7.01% |
12.36% |
6.88% |
7.13% |
5.68% |
|||||
Fixed Income |
Latest Price |
Week |
Month |
YTD |
1-Year |
iShares Cdn Universe Bond ETF |
$32.07 |
-0.31% |
-1.2% |
1.5% |
2.3% |
iShares Cdn Long Term Bond ETF |
$24.83 |
-0.60% |
-2.5% |
5.0% |
7.1% |
iShares Cdn Short Term Bond |
$28.36 |
0.00% |
-0.2% |
-0.5% |
-0.5% |
CDN 30 yr yield |
$1.88 |
1.32% |
11.5% |
-14.0% |
-19.7% |
US 30 yr yield |
$2.59 |
2.90% |
10.6% |
-14.0% |
-11.7% |
Exchange Rates |
Latest Price |
Week |
Month |
YTD |
1-Year |
Canadian Dollar ($US) |
$0.75 |
-0.17% |
-2.2% |
3.2% |
-2.5% |
Canadian Dollar (Euro) |
$0.68 |
-1.12% |
0.1% |
2.1% |
-2.3% |
Canadian Dollar/British Pound |
$0.61 |
-1.01% |
3.8% |
24.8% |
22.8% |
Canadian Dollar (Yen) |
$78.19 |
0.40% |
1.2% |
-10.0% |
-15.2% |
Commodities |
Latest Price |
Week |
Month |
YTD |
1-Year |
RJ/CRB Index |
186.28 |
-1.67% |
0.0% |
5.2% |
-4.8% |
Bloomberg Livestock |
$25.28 |
3.27% |
5.3% |
-17.9% |
-21.4% |
Gold |
$1,288.70 |
0.74% |
-3.3% |
20.1% |
11.5% |
Natural Gas |
$3.03 |
6.89% |
4.1% |
36.7% |
30.4% |
Light Sweet Crude Oil |
$46.64 |
-7.24% |
-2.9% |
26.5% |
0.6% |
CBOE Volatility Index |
13.34 |
0.00% |
0.4% |
-26.7% |
-11.5% |
 RETURN TO HOME PAGE
Related Articles
Estate Settlement & Administration, Investment Management, Kerr Family Office


