June 01, 2016 – KERR MARKET SUMMARY – Volume 5, Number 11
After April’s wobbly market which eventually left the S&P 500 marginally positive for the year, equity markets were mostly sideways this month as investors digested uneven economic signals. Having absorbed the earnings recession of 2015, macroeconomic forces such as strengthening oil prices, no news from China and the Fed’s potential next move appear to be driving investor sentiment. The Fed’s “on again-off again” comments, like a broken record, are proving unsettling to investors who are both worried about the impact of rate hikes and that the Fed’s dithering may even make things worse. With the price of oil holding at the $50 range, inflation trending at 2% and continuing labour gains, a rate hike in June now seems more certain. Whenever the next rate hike does come, it is sure to cause additional market volatility. In addition, political tail risk is now elevated with the looming U.K. “Brexit” vote and an increasing chance of a U.S. “Trumpet” – with the presumptive election of Trump as the Republican nominee.
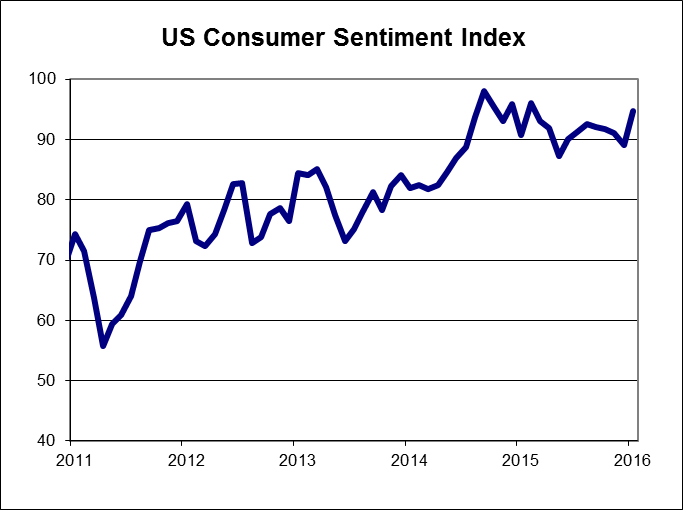
Equities were initially volatile at the start of the month with a poor corporate earnings outlook out of Europe serving as a catalyst. In addition, the ECB slashed its 2016 inflation forecast to 0.2% from an initial 0.5% – well below the Bank’s target of 2%. In most developed countries, profit taking was also on display as energy and materials shares fell despite a rise in oil prices. In the U.S., labour market reports showed some signs of fragility with April’s payroll growth falling short of estimates. Disappointing earnings from retailers also raised worries about the health of the American consumer; however, encouraging signs were found in the University of Michigan’s gauge of consumer sentiment which reached its highest level in a year. Japanese stocks, typically export oriented, entered correction territory as the yen strengthened to a two-year high versus the U.S. dollar. Investors seem bemused by the BoJ’s decision not to delay further stimulus in light of Japan’s deflationary trajectory. In addition to Japan’s sluggish economic growth, the BoJ’s policy mistake to further weaken its currency through negative interest rates has made the Yen’s outlook unpredictable with recent gains affecting corporate earnings. For the first-half of the month, Canadian and U.S. equities were mixed at -0.4% and +0.7% respectively. EAFE markets were down 3.2% along with Japanese equites (-1.9%).

Closing off the month, Canada’s TSX continued to place well with a gain of 1% – this time helped by two-thirds of its sectors, with honourable mention to consumer staples (+4.7%), IT (+8.4%) and Telecoms (+6%). In local currency terms, the S&P 500 rallied 1.8% while the EAFE and Japanese indices declined by 0.8% and 1% respectively. Despite the month’s 7% rise in the price of oil, the loonie declined 4% for the month – possibly on expectations of a June FED rate hike and/or a BoC rate cut. Whatever the reason, this bolstered the S&P 500, EAFE and Japan indices to positive territory at 6.2%, 3.5%, and 3.3% respectively in Canadian dollar terms.
NEWS FOR THE SECOND HALF OF MAY, 2016

The Thomson Reuters/University of Michigan consumer sentiment index jumped to 94.7 in May from 89.0 in April. Consumers were more optimistic about current economic conditions and economic conditions in the coming months.
US personal income rose by 0.4% in April, reflecting continued strong job growth, while consumer spending rose by 1.0%, sparked by motor vehicle and parts sales, which grew at the strongest pace in two years.

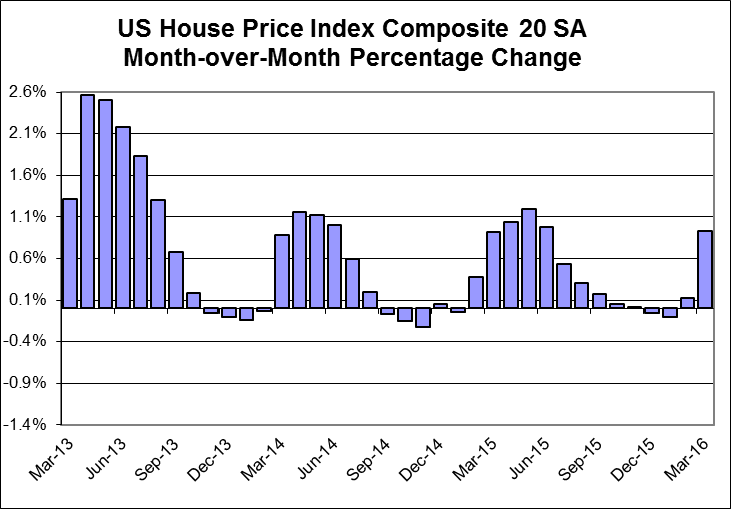
The S&P/Case-Shiller home price index for 20 US cities rose by 5.4%, year-over-year, in March, which was in line with expectations.

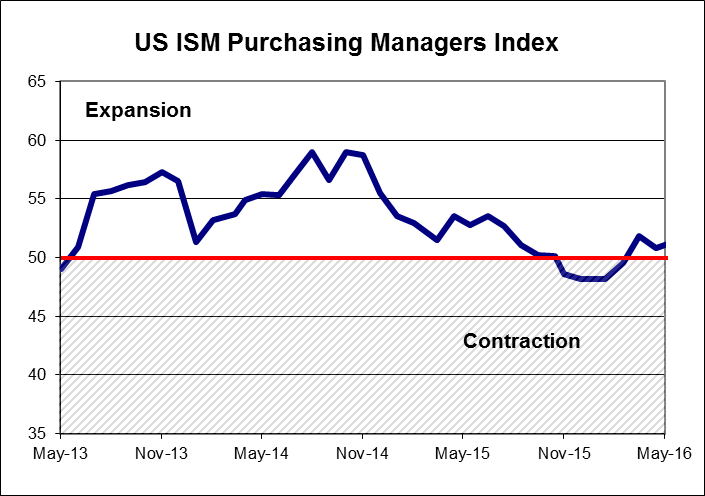
The ISM manufacturing index rose in May by 0.5 to 51.3, as new orders and production grew, while export orders and employment were unchanged.
OTHER ECONOMIC NEWS
US existing homes sales rose by 1.7% to 5.45 million annualized units in April. US housing starts rose by 6.6% in April to 1.172 million units, beating expectations. Building permits rose by 3.6%. US new home sales surged by 16.6% to 619,000 annualized units in April, the highest level since January 2008. Orders for US durable goods increased by 3.4% in April, with March’s number being revised upwards. Orders for non-defence capital goods, excluding aircraft, a closely watched indicator of business spending, fell by 0.8%, the third consecutive monthly decrease. The second estimate of first quarter US GDP showed annualized growth of 0.8%, an increase from the first estimate of 0.5% last month. US consumer prices rose by 0.4% in April, with the annual inflation rate rising to 1.1%, from 0.9% in March.
CANADIAN ECONOMIC NEWS
Canada’s GDP for the first quarter rose by 2.4% on an annualized basis. However, the quarter ended on a down note as the economy shrank by 0.2% in March, with weak investment in the energy sector being a key contributor to the decline. Canadian retail sales fell by 1.0% in March following strong gains the previous two months. The annual inflation rate in Canada rose to 1.7% in April from 1.3% in March.
Sources: TD Securities, Case Shiller, Reuters, Institute for Supply Management, Thomson Reuters/University of Michigan, Commerce Department, National Association of Realtors, Statistics Canada.
| May 31, 2016
Total Returns in CDN$ |
1M | 3M | 1Y | 3Y | 5Y | 10Y | |||||
| Canada | |||||||||||
| S&P/TSX Composite | 0.82% | 9.37% | -6.32% | 3.60% | 0.38% | 1.82% | |||||
| S&P/TSX 60 | 0.69% | 8.71% | -6.17% | 4.17% | 0.80% | 2.25% | |||||
| Cdn. Energy | 1.51% | 23.62% | -13.71% | -9.04% | -10.77% | -5.81% | |||||
| Cdn. Materials | -6.65% | 15.74% | -2.05% | -4.85% | -12.06% | -0.04% | |||||
| Cdn. Industrials | 1.54% | 10.93% | -3.75% | 7.78% | 8.39% | 7.00% | |||||
| Cdn. Consumer Discretionary | 3.24% | 7.52% | -6.39% | 14.69% | 12.04% | 4.73% | |||||
| Cdn. Consumer Staples | 4.63% | 0.65% | 16.04% | 23.66% | 19.80% | 10.82% | |||||
| Cdn. Health Care | -1.31% | -7.23% | -30.64% | 8.66% | 9.56% | 6.03% | |||||
| Cdn. Financials | 0.84% | 10.71% | 0.25% | 7.70% | 4.99% | 2.99% | |||||
| Cdn. Information Technology | 8.33% | 3.75% | 5.62% | 18.37% | 10.06% | 8.30% | |||||
| Cdn. Telecom. Services | 6.22% | 5.10% | 15.13% | 7.19% | 8.18% | 6.58% | |||||
| Cdn. Utilities | 3.07% | 10.09% | 2.09% | 1.71% | 0.27% | 1.61% | |||||
| U.S. & International ($CDN) | 1M | 3M | 1Y | 3Y | 5Y | 10Y | |||||
| S&P 500 (LargeCap) | 1.53% | 8.53% | -0.49% | 8.74% | 9.29% | 5.14% | |||||
| Russell 2000 | 2.12% | 11.69% | -7.36% | 5.47% | 6.36% | 4.82% | |||||
| World | 0.23% | 8.24% | -5.88% | 4.39% | 4.33% | 2.39% | |||||
| Europe | -1.36% | 6.43% | -12.54% | -0.91% | -1.39% | -0.99% | |||||
| Japan | -1.02% | 7.58% | -9.84% | 2.40% | 3.06% | -1.48% | |||||
| Pacific ex-Japan | -2.94% | 10.07% | -14.67% | -5.12% | -3.69% | 1.47% | |||||
| EAFE (Europe, Aus, Far East) | -1.50% | 7.04% | -12.17% | -0.68% | -0.76% | -0.91% | |||||
| EM (Emerging Markets) | -3.90% | 9.07% | -19.59% | -7.15% | -7.12% | 0.73% | |||||
| Total Returns in CDN$ | 1M | 3M | 1Y | 3Y | 5Y | 10Y | |||||
| Fixed Income | Latest Price | Week | Month | YTD | 1-Year |
| iShares Cdn Universe Bond ETF | $31.90 | 0.25% | 0.5% | 0.7% | -0.4% |
| iShares Cdn Long Term Bond ETF | $24.38 | 0.95% | 1.0% | 2.9% | 0.7% |
| iShares Cdn Short Term Bond | $28.42 | 0.00% | 0.0% | -0.4% | -1.3% |
| CDN 30 yr yield | $1.96 | -2.15% | -6.0% | -8.8% | -12.3% |
| US 30 yr yield | $2.63 | -0.49% | -1.4% | -12.6% | -10.9% |
| Exchange Rates | Latest Price | Week | Month | YTD | 1-Year |
| Canadian Dollar ($US) | $0.76 | 0.28% | -4.3% | 5.6% | -4.4% |
| Canadian Dollar (Euro) | $0.68 | 0.41% | -1.5% | 3.0% | -6.1% |
| Canadian Dollar/British Pound | $0.53 | 1.33% | -3.3% | 8.0% | 0.4% |
| Canadian Dollar (Yen) | $83.72 | 0.93% | -0.4% | -2.8% | -15.2% |
| Commodities | Latest Price | Week | Month | YTD | 1-Year |
| RJ/CRB Index | 186.36 | 1.53% | 0.8% | 5.1% | -16.7% |
| Bloomberg Livestock | $30.93 | 3.50% | 2.4% | -0.1% | -14.4% |
| Gold | $1,214.90 | -0.95% | -5.7% | 14.8% | 2.4% |
| Natural Gas | $2.29 | 15.56% | 5.1% | 3.3% | -13.6% |
| Light Sweet Crude Oil | $48.82 | 0.99% | 6.9% | 32.6% | -18.4% |
| CBOE Volatility Index | 14.43 | -1.60% | -9.6% | -22.1% | 1.6% |


